How to Measure Welcome Email Effectiveness: 11 Important Metrics
Table of Contents Jump to:
Jump to:
Table of contents
When someone first signs up for your newsletter, registers for a new course on your website or makes a purchase from your online store, it’s time for a welcome email.
Lucky for you, these introductory emails can pack quite a punch when it comes to results, creating up to an 86% lift in open rate and a 196% lift in click rate.
To fully evaluate the effectiveness of your welcome emails though, it’s important to understand all the metrics, what they mean, how they affect each other and what factors influence them.
In this guide, we’ll cover 11 key email marketing metrics you can use to measure welcome email effectiveness:
- Open rate
- Click rate
- Total opens and clicks
- Conversion rate
- Deliverability rate
- Bounce rate
- Marked spam or complaint rate
- Unsubscribe rate
- Forward or share rate
- List growth rate
- Campaign ROI
Get unlimited email sends & subscribers with Flodesk
We’ll never increase pricing because your email list is growing
What makes a welcome email effective?
There are several ingredients that go into sending an effective welcome email—the welcoming subject line, the email graphics, the content and the timeliness, to name a few.
But it’s well worth the trouble. Effective welcome emails offer the following benefits:
- Increased revenue—Welcome emails generate up to 320% more revenue per email than other promotional emails.
11 important metrics to measure welcome email effectiveness
In this section, we’re going to take a close look at each metric. We’ll cover why it’s important, how it’s calculated and what you can do to improve it. To learn more, check out the video Understanding Your Flodesk Email & Workflow Analytics at Flodesk University.
Metric 1: Open rate
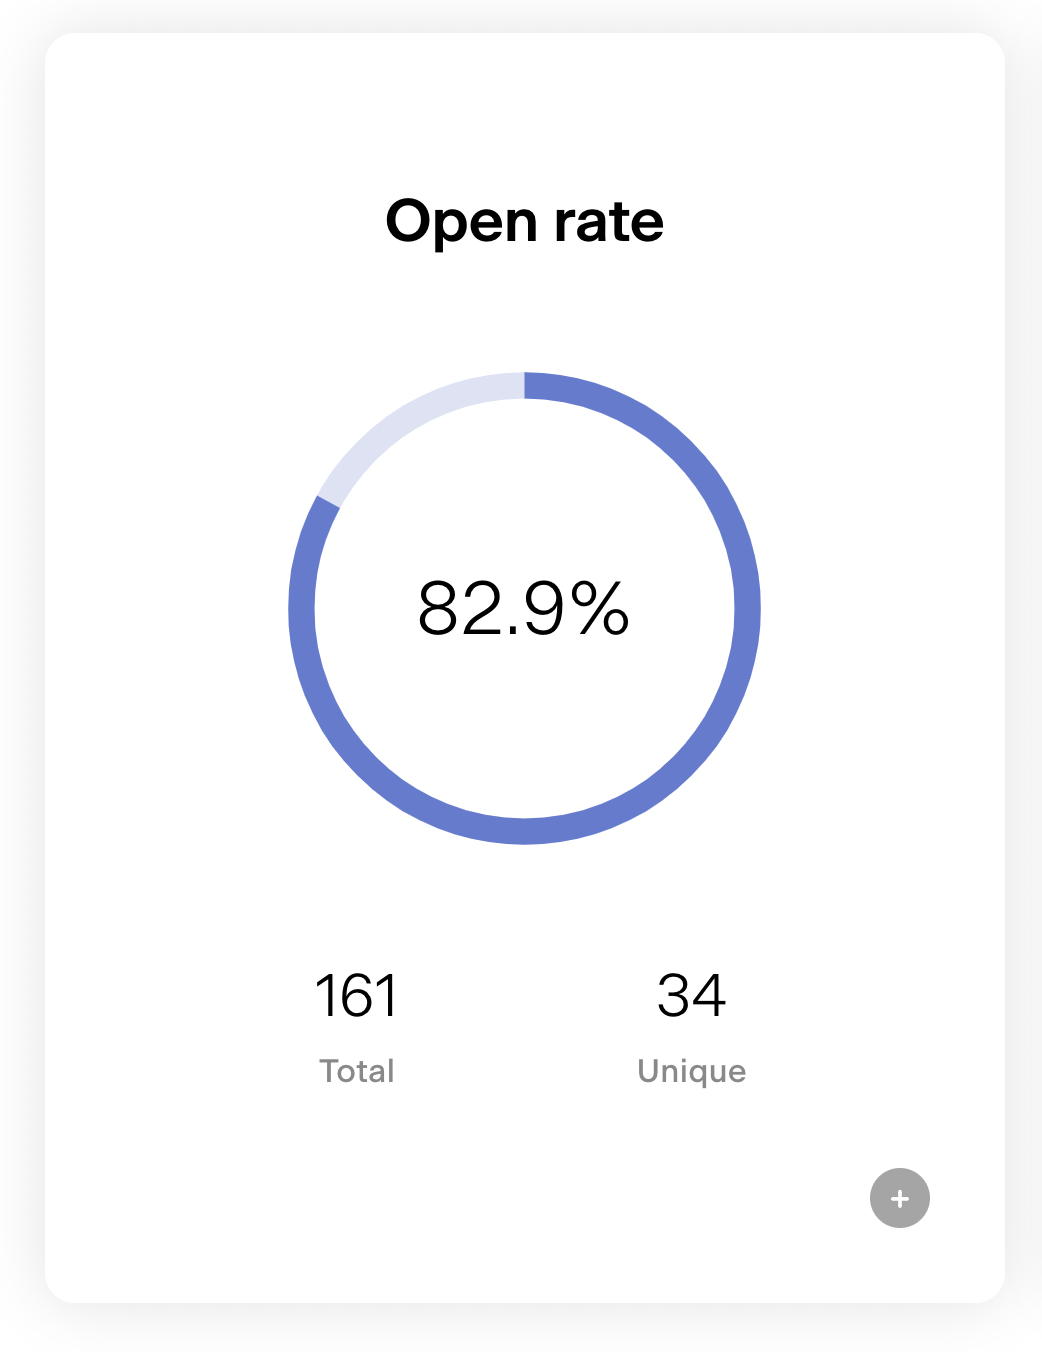
The open rate tells you how often recipients are opening your welcome emails. It’s a very important metric in email marketing because getting subscribers to open your welcome email is one of the first hurdles you need to clear.
Flodesk calculates your open rate by taking the unique number of people who opened your email and dividing it by the total number of emails delivered. So if you send 10,000 emails (all delivered) and 2,000 people open them, your open rate would be 20%.
For a normal email, a 20% open rate would be pretty darn good. Welcome emails, however, tend to have much higher open rates compared to other emails (sometimes as high as 91%!)
It’s important to look at open rates for individual campaigns but also as a trend over time. This is because open rate trends are a good indicator of overall engagement. If your open rate starts to fall, check to see if you’re doing any of the following:
- Sending too many emails (or too few)
- Using lackluster subject lines
- Sending generic content instead of targeting different subscriber segments
One last thing to keep in mind: Apple launched its Mail Privacy Protection (MPP) feature in September 2021. This impacts how open rates are measured for Apple device users and may translate into open rates becoming less reliable.
Metric 2: Click rate
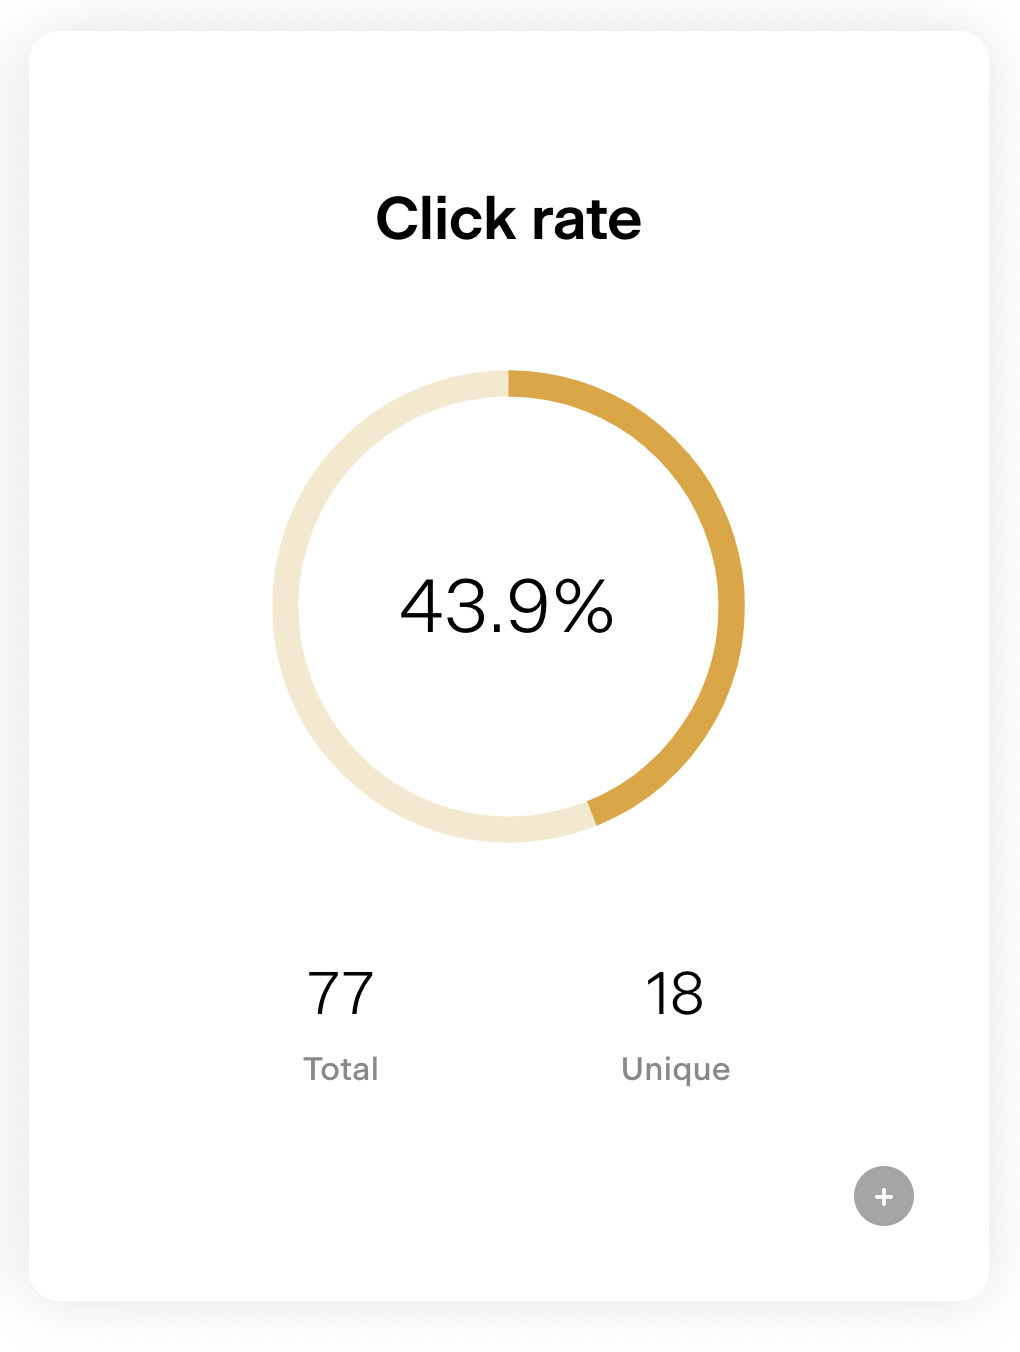
The click rate tells you how many recipients click on the link(s) inside your welcome email. It’s an important measure of engagement since it shows the percentage of subscribers who go beyond just opening your email and actively engage with your content.
At Flodesk, we calculate the click rate by taking the unique number of people who clicked and dividing it by the total number of emails delivered. For example, let’s say you send 2,000 emails and 100 people click on your link. Your click rate is 100/2,000 = 5%.
If your click rate could use a boost, keep the following factors in mind:
- Inspire readers to take action by providing something of value. This can be a discount code, a free download, a relevant case study and more.
- Make sure it’s easy for customers to take action by testing out your email on multiple devices, especially mobile.
- Optimize your copywriting and link placement. You can run A/B testing to determine the best anchor text, location of the link in the body of the email, the number of times you include the link and the copy leading up to the link.
Metric 3: Total opens and clicks
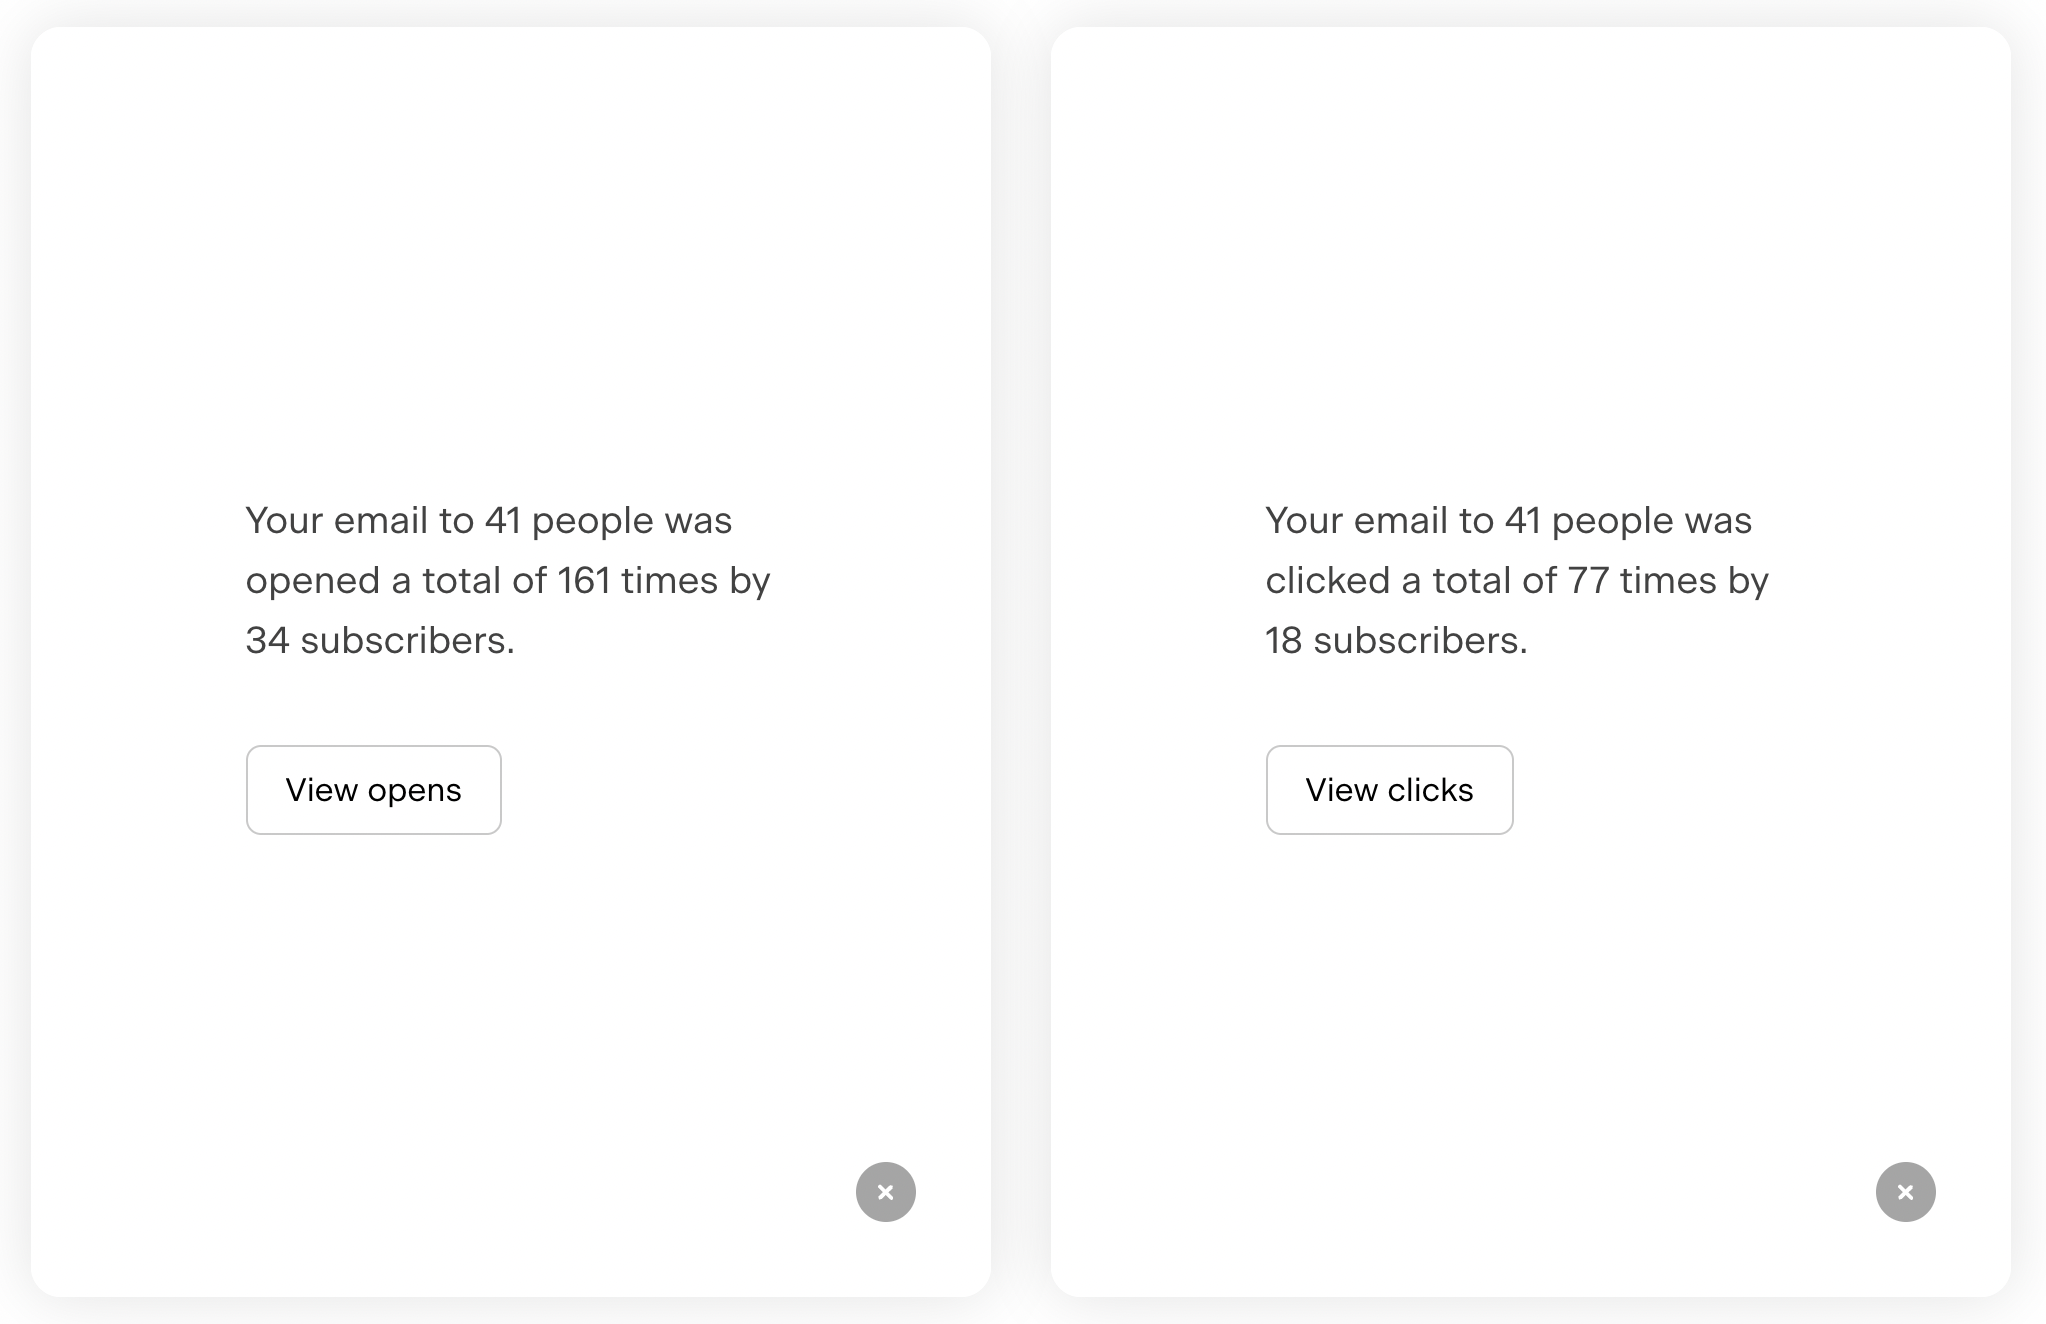
Total opens and clicks can be slightly different from your regular unique open and unique click rates. Here’s why. If you send a welcome email to a subscriber, let’s call her Amanda, and she opens your email 5 times, those 5 opens count towards your total opens.
However, Amanda would only count as 1 ‘unique open’ because unique opens and clicks tell you how many individual subscribers opened your email (or clicked on it).
We find this differentiation useful. We’re glad Amanda loved the email so much she opened it 5 times, but we also want to know how many individual subscribers opened it at all. We include this in plain language in your email analytics dashboard.
Metric 4: Conversion rate
A step up from click-through rate is your conversion rate. This is a measure of not just how many people are clicking on your links, but how many are actually completing your desired action. It’s calculated by taking the total number of conversions and dividing it by the total number of emails delivered.
Since the conversion rate depends on your desired action, it will be based on different variables for different emails. Let’s say you have an e-commerce site, for example, and you’re running an email campaign that encourages recipients to click through and purchase a product. Your conversion rate, in this case, will reflect the number of people who make a purchase.
If you’re running an email campaign encouraging people to follow you on social media, however, then your conversion rate will be a measure of the number of recipients who click through your link and become new followers.
One thing to keep in mind with conversion rates is that there are many factors beyond your email that can affect the outcome. For example, many times a conversion rate depends on a customer taking action on your website after clicking a link inside your email.
Metric 5: Deliverability rate
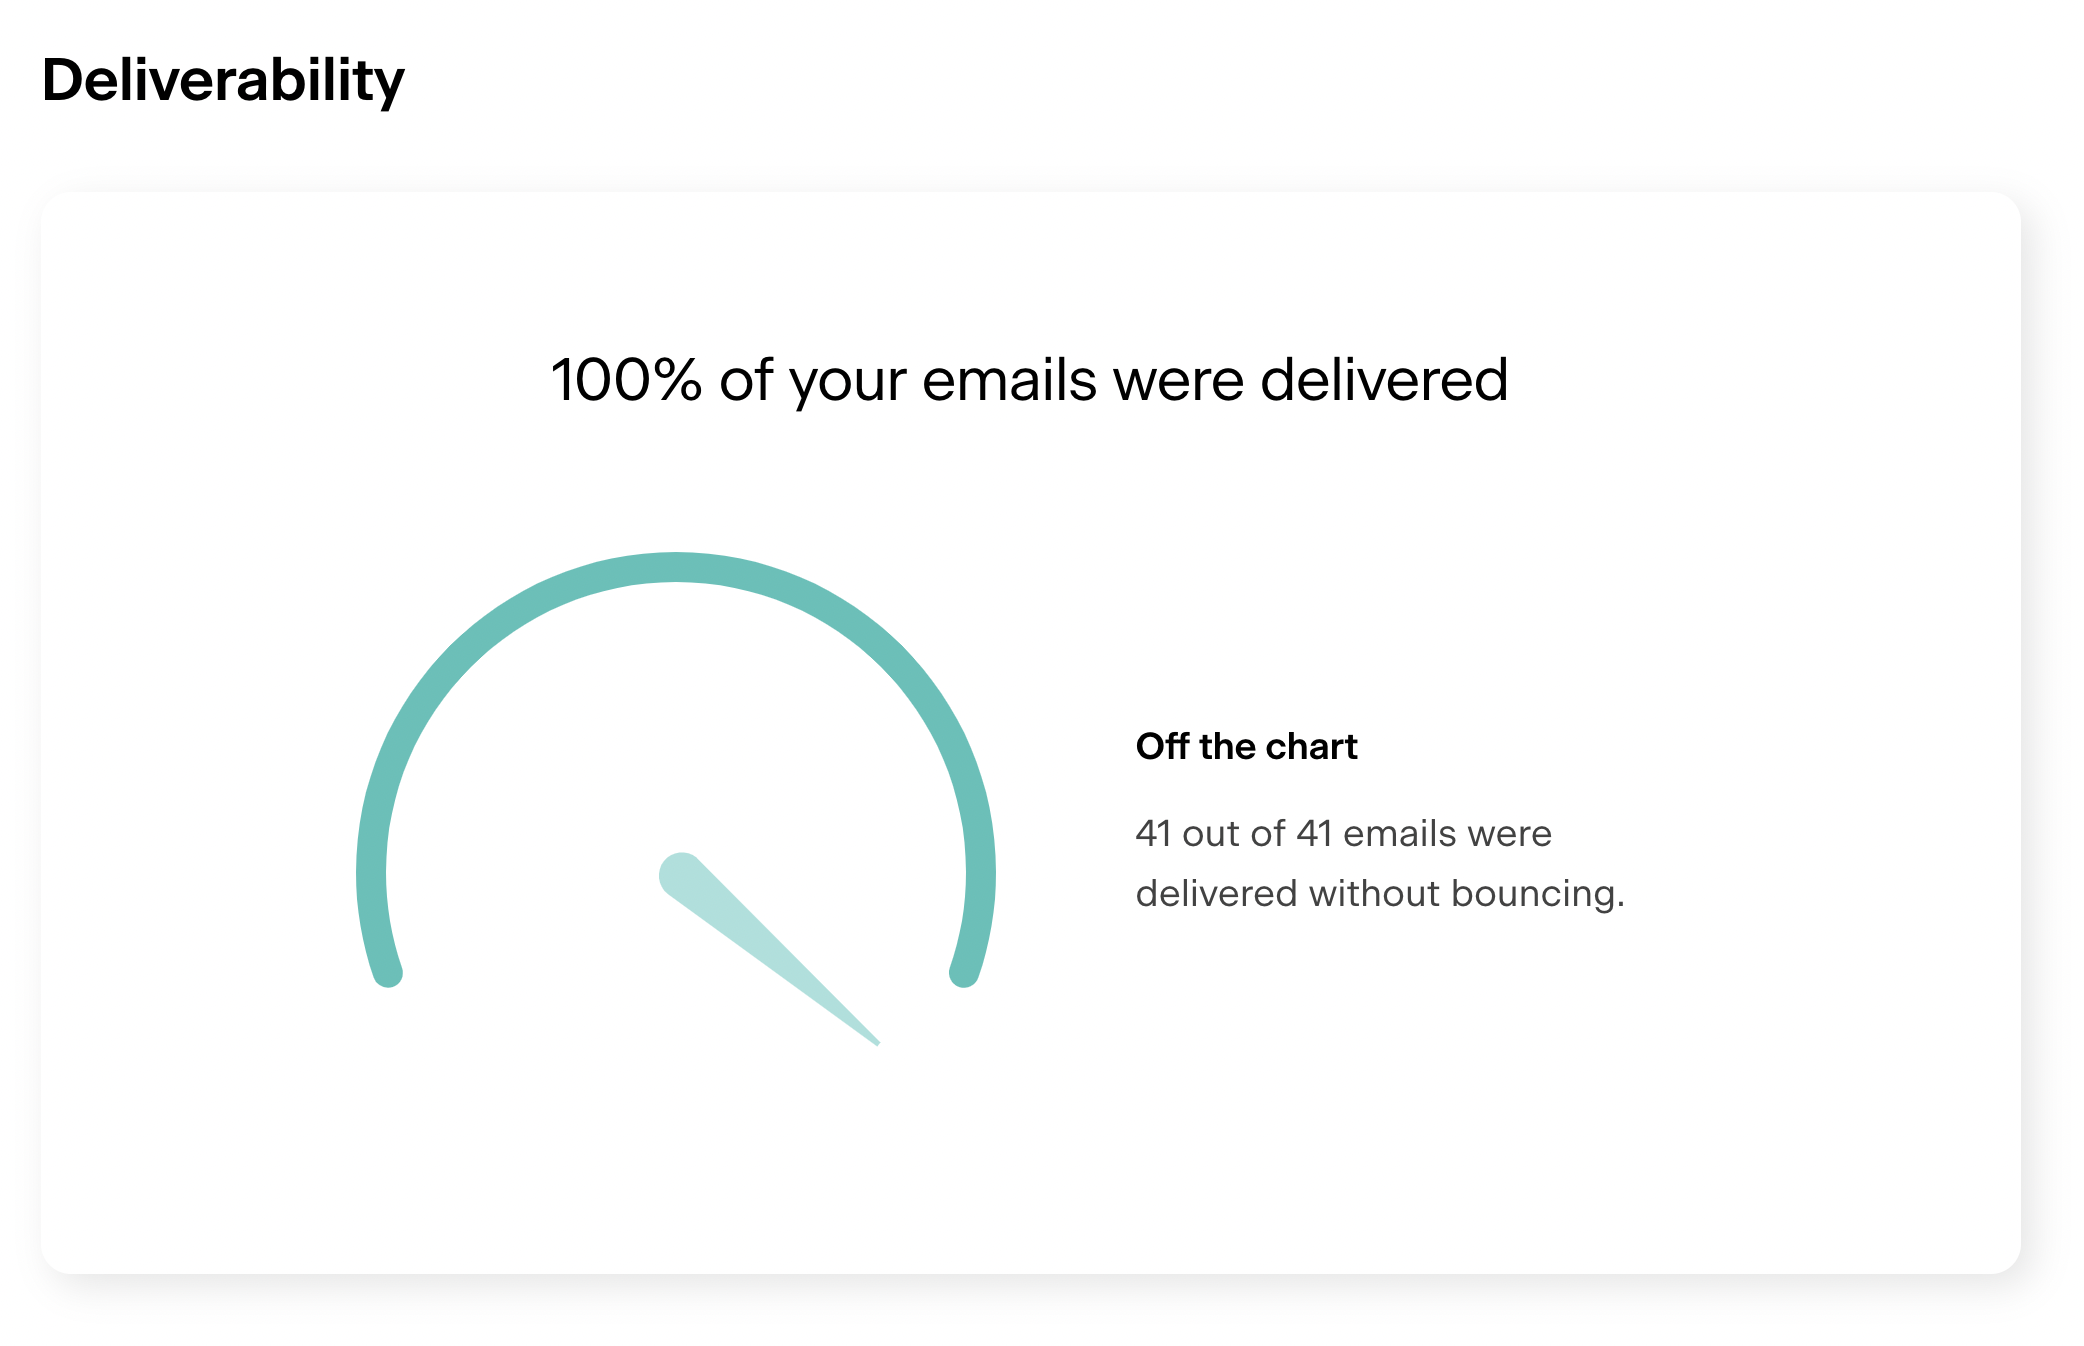
The deliverability rate of an email campaign tells you how many emails actually made it to the recipient’s inbox. It’s an important metric because it speaks to the health and accuracy of your email list and can affect your sender reputation.
At Flodesk, we calculate your deliverability rate by taking the total number of emails delivered and dividing it by the total number of emails sent. If you send 2,000 welcome emails, for example, and 1,960 are delivered, your deliverability rate would be 1,960/2,000 = 98%.
(Is your deliverability rate too low? Check out this article on improving your email deliverability rate in our help section.)
Metric 6: Bounce rate
Up until this point we’ve covered only positive metrics, ones where you want all the numbers to be super high. (100% click rate, yes please!) But for bounce rate, you want the numbers to be low- as close to zero as possible.
This is because bounce rate is a measure of the number of emails that aren’t successfully delivered, usually because they’ve been blocked or flagged as spam. It’s essentially the inverse of your deliverability rate.
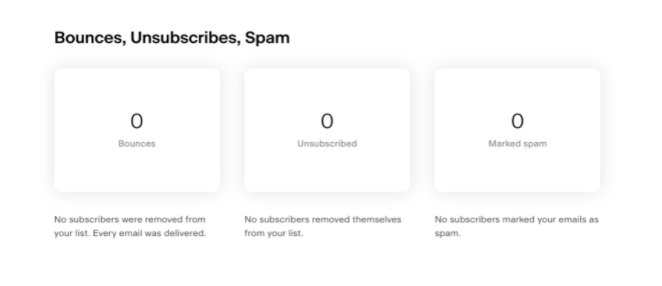
When you use Flodesk for your email marketing, you can see how many emails bounced right on your analytics dashboard, making it easy to see where you’re at. With that in mind, here are a few tips to keep your bounce rate down:
- Take the time to clean your email lists regularly.
- Don’t send anything that looks (or acts) like spam.
- Don’t send your welcome emails from a free email service like Gmail or Hotmail.
- Personalize your welcome emails as much as possible.
- Get permission from your subscribers.
- Consider using a double opt-in process.
- Give your subscribers control over what types of emails they receive from you.
- Send emails regularly (but not too frequently.)
Get unlimited email sends & subscribers with Flodesk
We’ll never increase pricing because your email list is growing
Metric 7: Marked spam or complaint rate
Another metric you want to keep as low as possible is the ‘spam complaint’ rate—a measure of how many email recipients mark your email as spam. At Flodesk, we include this number in your analytics workflow.
The acceptable standard spam complaint rate (set by major inbox providers like Gmail) is considered anything less than 0.1%, or 1 complaint for every 1,000 messages.
For example, if you send 10,000 welcome emails and 5 people mark it as spam, your spam complaint rate would be 0.05%, falling below the industry benchmark.
There are many things you can do to keep your spam rate low like cleaning your email list, including unsubscribe links and only sending relevant content. But one of the best defenses against spam complaints is actually your welcome email.
Sending a welcome email (or series of onboarding messages) to a new subscriber will familiarize them with your brand and let them know what to expect from you in the future, making it less likely that they’ll mark your messages as spam when they show up in their inbox.
Metric 8: Unsubscribe rate
This metric is just what it sounds like: a percentage of recipients who click on the unsubscribe link in your emails. Like the bounce rate and spam rate, you generally want to keep this number low (and you can find it right beside them in your Flodesk analytics dashboard.)
As a point of reference, an unsubscribe rate below 0.5% is good for an email campaign. A rate below 0.2% typically indicates that you are within the norm and a rate above 0.5% means you have some work to do.
That said, not all unsubscribes are bad. It’s much better for a recipient to unsubscribe than flag you as spam, for example. Plus, unsubscribes do a bit of house cleaning for you by removing themselves before they start dragging down your other metrics, like click rate and conversion rate.
Sometimes, you might even want to unsubscribe people from your list proactively. Take the case of HubSpot, for example. They recently unsubscribed 250,000 followers (nearly 45% of their list) in order to create a higher-converting email base.
Interestingly, they did it by setting up a workflow that automatically unsubscribed their unengaged subscribers – people who reached a certain threshold of non-engagement (HubSpot chose to use not clicking on an email in the last six months.) You can set up the same type of workflow in Flodesk using conditions. Check out How to Create Your First Email Workflow in Flodesk to learn more.
Phew, enough of the downers! Time for another positive metric—the ‘forward’ or ‘share rate’. This is the percentage of your readers who forward your welcome email, or share it using a share button inside the email.
Having a high forward or share rate is a huge win. This means your subscriber liked your content so much that they sent it to a friend, essentially generating new leads for you, and you can’t ask for better brand engagement than that.
Metric 10: List growth rate
You know what they say in business: “if you’re not growing, you’re dying.” Well, it applies to email lists too- and it’s because email lists tend to “go bad” over time. People lose interest and unsubscribe, or mark you as spam, or they switch email accounts, leaving you with an old, abandoned one that just drives up your bounce rate.
So, you should be constantly trying to grow your email list by adding new subscribers. Your list growth rate will tell you how well you’re doing. It shows the rate at which your email list has grown over a certain period of time.
Here’s how to calculate it: New subscribers – (unsubscribes + complaints) / Total subscribers over a specific period of time
Metric 11: Campaign ROI
Last but not least is campaign ROI. This measures the overall return on your investment for your email campaign—basically, did you make more money than you put in? This is a very important email marketing metric for e-commerce.
The first step in calculating your ROI is to figure out how much you spent on your campaign. This seems simple at first, but it can get tricky, especially when it comes to allocating general expenses to a particular campaign.
The next step is to figure out your ‘gain’, or how much your campaign brought in. Fortunately, most analytics platforms will trace every sale that comes from an email, making this part fairly easy.
Then, you plug it into the formula: (Gained – spent)/spent = ROI.
Effective welcome email examples (and why they work)
Now that you know all about metrics, let’s take a look at a few examples of effective welcome emails and figure out why they work.
The “freebie” welcome email

The “freebie” is one of the most effective types of welcome emails out there. It works because it entices the recipient to open the email by providing value.
Freebies come in all shapes and sizes—ebooks, PDF guides, bonus packs, workbooks, checklists, case studies, cheat sheets, etc. Whatever you choose, remember the following:
- Make sure it solves a real, specific problem for your target customer
- Make sure it’s clear that the freebie is included when you write the welcome email
- Make sure it’s easy to download
Take the welcome email example above from Her First 100k. Right off the bat, it’s clear to subscribers that this email has the goods. The subject line reads “Your free ebook awaits” and as soon as subscribers open the email, they see a colorful graphic with a nice, clear button they can click on to download the item.
The “double opt-in” welcome email

Another effective type of welcome email is the double opt-in, which asks subscribers to confirm that they actually signed up for your emails. While it might seem like an unnecessary step, it can actually create a more engaged email list by weeding out people who don’t really want to be there—improving metrics in the process.
The email above from Saffron Ave is a good example of this. Angela tells new subscribers, “You’re just about done. Just hit the button below to confirm!”
The “discount code” welcome email

Another effective type of welcome email is one that includes a discount code or special offer. Similar to the freebie, it works because it entices people by providing value. Recipients are tempted to not only open your email but to click through and make a purchase.
As you can see in the email above from Alixx, they give new subscribers a code for 10% off their first purchase over $50. This is a smart play because Alixx is offering subscribers value while still ensuring their own profitability.
Run the best welcome email campaigns with Flodesk
As the fastest-growing email marketing company, Flodesk makes email marketing beautiful—and truly easy to use. Combining design with simplicity, Flodesk helps small business owners grow their email lists and create emails people love to get.
Flodesk also makes it easy for small business owners to send effective, metric-crushing welcome emails by focusing on the things that matter most:
- Attention-grabbing and personalized subject lines
- Using beautiful newsletter design and compelling copy
- Automated workflows to ensure immediate delivery
- Providing value through freebies, discounts and more
Hopefully this guide demystified metrics a bit and you feel ready to analyze your welcome emails like a pro. You’ve got this!
Get unlimited email sends & subscribers with Flodesk
We’ll never increase pricing because your email list is growing
Welcome email measurement FAQs
Still have questions about welcome email metrics? We’ve got your back. Here are answers to some frequently asked questions.
How effective are welcome emails?
Research shows that new leads are most engaged within 48 hours of subscribing, making welcome emails extremely effective. They can produce up to an 86% lift in unique open rate and 196% lift in unique click rate. And if you automate your welcome emails, the process can become increasingly effective.
How do you measure the effectiveness of an email marketing campaign?
There are 11 key email marketing metrics you can use to measure the effectiveness of an email marketing campaign:
- Open rate
- Click rate
- Total opens and clicks
- Conversion rate
- Deliverability rate
- Bounce rate
- Marked spam or complaint rate
- Unsubscribe rate
- Forward or share rate
- List growth rate
- Campaign ROI
What is the most important metric in email marketing?
There is no single metric that is the most important in targeted email marketing. Each one provides a unique insight into how a particular aspect of your email is performing. They’re most powerful when considered as a whole and in relation to each other.


Related Articles